I use spreadsheets to track my editing progress as I work my way through a manuscript. It shows me very clearly how much progress I’ve made and how much left I still have to do.
I tweaked the spreadsheet I created for myself to make it into a template anyone can use (in theory—let me know if you’re unable to save a copy for yourself!).
Here’s the spreadsheet in Google Sheets. Go to File > Save a Copy to save and modify your own.
(The Google Sheets version also has formulae if you don’t want to work chronologically!)

If that doesn’t work, I’ll walk you through the steps to make your own.
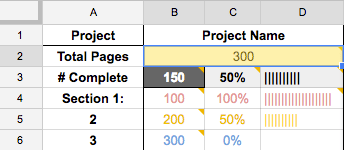
First open up a new spreadsheet and include the column headers (Project, Project Name) and row headers (Total Pages, # Complete, Section 1, 2, etc.) as seen above. If you have more than one project, create more rows for that.
Each project is three columns, with its first two rows each merged into one cell, which is why Project Name and the number of total pages are both centered. So merge B1+C1+D1 into one cell and repeat for B2+C2+D2.
Then in B2, enter the total number of pages for your project. In this example, I’ll use 300 since it’s a nice round number.
I filled B3 with a dark gray and turned the text white to remind me that when this template is all set up, that’s the only cell I need to update. I also set C3 and D3 with bold text and a very light gray fill, to set that progress apart as the total progress.
Decide how many sections you want to divide your project into. We’ll do three for this example, but you can add as many as you’d like.
Find the page number that Section 1 ends on. That’s the number you’ll put into B4. For example, if Section 2 starts on page 109, then Section 1 ends on 108, so enter 108 here.
Repeat for the remaining sections. Your last section (Section 3, or B6 here) should have the same number as your total pages (B2).
The total percentage completed (C3) is easy enough: it’s the number complete divided by the total number of pages. So in C3, enter
=B3/B2
This is where the formulae get a little tricky. We want to make sure that the numbers in column C stay between 0% and 100%.
The percentage finished in section 1 (C4) is the number of pages complete divided by the total pages, maxing out at 100%. So in C4, enter
=MIN(B3/B4,1)
The percentage finished in section 2 (C5) is the number of pages complete (B3), minus the number of pages in Section 1 (B4) divided by the total pages (B2), with a minimum of 0% and maxing out at 100%. So in C5, enter
=MAX(MIN((B$3–B4)/(B5–B4),1),0)
(Yeah, I definitely had to do some digging to figure that one out!)
For C6, you can copy and paste C5. Thanks to the trick Leigh suggested in the comments (adding the $), that first cell will stay B3 even when you copy and paste.
You can continue copying and pasting, but make sure that the formulae in the percentage column always start with the total number of pages. In my template, those cells are shaded dark gray.
Now for column D, the bar graphs. This is something else I had to look up and modify to fit my needs.
All we’re doing is taking the percentages in column C and turning them into graphs, with one vertical line (shift + the key under “backspace” or “delete”). We want 1 line for each 5%.

Start with D3:
=REPT(“|”,(C3*20))
Then copy and paste down the column. The C3 will adapt for each cell, changing to C4, C5, etc.
One last thing: quickly enter the total number of pages into B3 so you can see how much 100% is, then rescale the D column to fit. Otherwise 100% won’t look like 100% 🙂
If you save a copy of the template I created, you can copy and paste the H–J columns to create more projects.
Now that you’ve got your spreadsheet all set up, update B3 with how many pages you’ve completed, and watch the bars fill up!
xo Lara